Dashboard
Overview
The Dashboard is the page Int4 Suite opens on after you sign in, and the page the logo and the "go back" buttons of error pages return to. It answers three questions at a glance: how much testing this installation has done, what happened in the last 24 hours, and what you yourself have been working on.
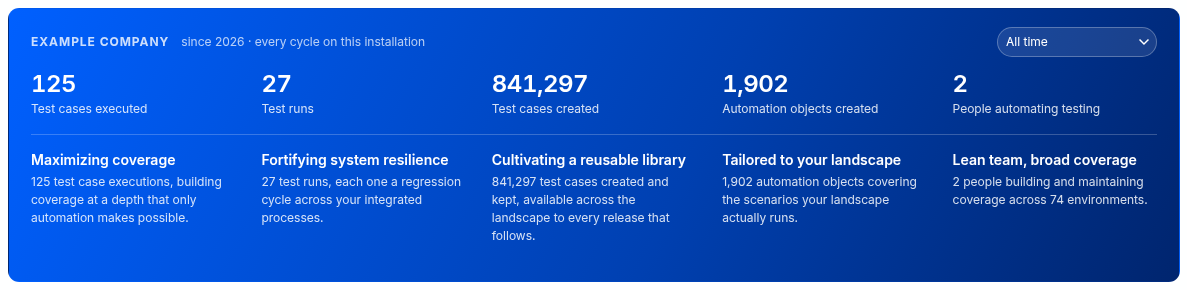
The Overview at the top shows the scale of the testing programme on this installation — test cases executed, test runs, test cases created, automation objects created, and the number of people who build and run the tests — each with a short statement of what that figure means. These totals are the same for everyone who opens the page. Choose the reporting period in the top right: the whole history of the installation, the last 12 months, or the period since your current licence was issued (offered only when a valid licence is installed).
Below it, three summary boxes give you the last day at a glance: how many systems under test can be reached, how many test runs were executed and how many of them failed, and how many crawls ran, are still running, succeeded or failed. Each box opens the page with the full list.
The Systems box is fed by a background check that tries every configured connection of every system under test every 15 minutes. A system counts as connected when all its configured connections answered, and as not reachable when one of them failed. The box names the systems that are not reachable, with the reason from the last check, so you can open the system and fix it.
At the bottom you find your own work: your latest test runs and crawls, plus a row of Quick actions — shortcuts to the pages you open most, which you can choose yourself.
You see only the boxes your permissions allow: without access to systems under test, for example, the Systems box is simply not shown.
Tasks
How to follow up on a system that is not reachable
- In the Systems box, read the list of systems that are not reachable and the reason shown under each name.
- Select the system's name to open it.
- Correct its connection settings and save. The system is checked again on the next background run; until then it shows as pending.
- To check at once, use the connection check on the system's own page; the dashboard picks up the result straight away.
If the note Checks paused: the credentials were rejected appears, the system refused the stored user or password. Automatic checks stop for that connection so that repeated failed logons cannot lock the technical user. They resume once you save the system again or a manual connection check succeeds.
How to open your own runs and crawls
- In My recent test runs or My recent crawler runs, select a row to open that run.
- Select All my runs or All my crawls to open the full list, already narrowed to the runs you started.
How to arrange your dashboard
- Select Layout above the boxes.
- Drag a box by its grip to move it, or drag its right edge to make it wider or narrower. The arrow buttons on each box do the same from the keyboard, and a screen reader announces the box's new position or width.
- In Quick actions, select Add action to pin another shortcut, the cross on a shortcut to remove it, or its arrows to move it. Up to nine shortcuts can be pinned; when all nine are pinned but some are no longer available to you, adding a shortcut removes those.
- Select Done to save the arrangement, or Cancel to leave it as it was.
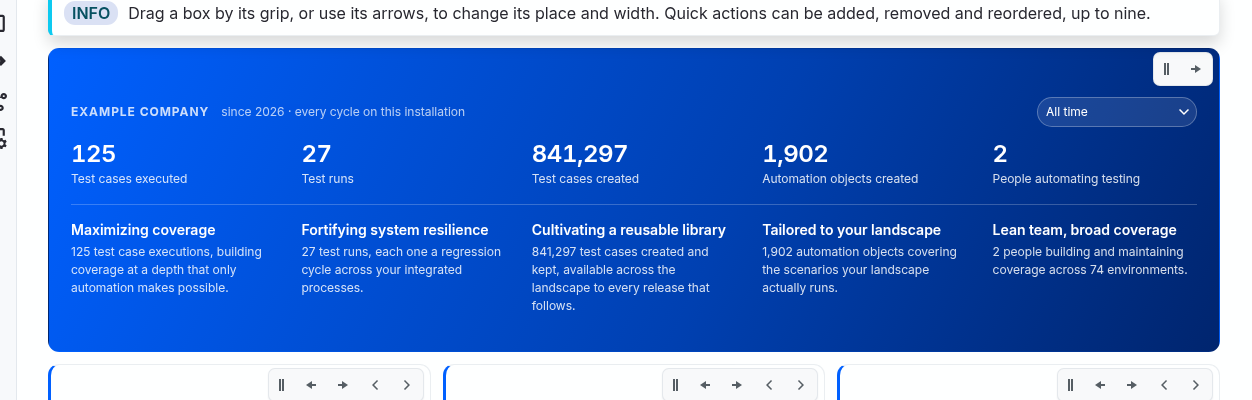
Your arrangement is saved for your user, so it follows you to any browser or computer.
How to return to the default arrangement
- Select Reset. The button is available once you have saved an arrangement of your own, and not while you are editing the layout.
Field reference
| Figure | Description |
|---|---|
| Test cases executed | Test case executions completed by the test runs started in the reporting period. |
| Test runs | Test runs started in the reporting period. |
| Test cases created | Test cases created in the reporting period that have not been archived. |
| Automation objects created | Automation objects created in the reporting period that still exist. |
| People automating testing | Different people who created test cases, test runs, automation objects or crawlers in the reporting period. |
| connected / not reachable | Systems under test you may see whose configured connections all answered at the last check, or at least one did not. |
| pending | Systems with a connection that has not been checked since the system was created or last changed. |
| not checked | Systems with no connection the background check can test. |
| executed / running / failed | Test runs started in the last 24 hours on the whole installation, those still pending or running (shown only while there are some), and those with at least one failed test case. |
| total / active / success / failed | Crawls started in the last 24 hours on the whole installation: all, still pending or running, finished successfully, failed. |
| Test type | The kind of automation object the run executed, or Mixed when it executed several kinds. |
| System | The system under test the crawler read from, or the system group for business-object crawlers. |
Tips & edge cases
- While the page is open, it checks every 10 seconds whether a test run or crawl has started, progressed or finished. When something has changed, the overview, the test run and crawl summaries and your own runs and crawls refresh together, and the figures count smoothly to their new values; the overview also shows how many runs are in progress. When nothing changes, these boxes and the systems box refresh every five minutes. Checking pauses while the browser tab is hidden, and returning to the tab refreshes the page at once.
- Preview crawls (crawlers in test run mode) are left out of every crawl figure, because their numbers are only a simulation.
- A run counts as yours when you started it. Scheduled test runs count for the owner of the schedule template; scheduled crawls for the owner of the schedule.
- Archiving a test case lowers Test cases created for past periods too; deleting an automation object lowers Automation objects created.
- My recent crawler runs shows Deleted crawler for a crawl whose crawler configuration was deleted since.
- Shortcuts you are not allowed to use are hidden, even when pinned; they reappear when you get the permission.
- Systems flagged as production are never sent a test message: their connection is judged by the read-only checks alone (for SAP Cloud Integration, the API). On other systems the background check runs the same probes as the manual check on a system's page, which for the SAP Cloud Integration runtime means posting a small test message every 15 minutes. Your administrator can switch the background check off for the whole installation.
Related features
Prerequisites & permissions
Every signed-in user sees the Overview and Quick actions and can arrange their own dashboard. The other boxes need:
- Systems — System Under Test: Read. Only the systems in project scopes you may read are counted and named.
- Test runs, last 24 h and My recent test runs — Test Case: Read, and a licence that includes test reporting.
- Crawlers, last 24 h and My recent crawler runs — Crawler: Read.
About permissions. What you can see and do is decided by the roles assigned to your user. Each role bundles permission groups, and each permission group allows activities — Read, Write, Delete, Execute and, for schedules, Change owner — on a kind of record (for example Test Case, Automation Object, System Under Test). A role grants its groups per project scope, so you may be allowed to change records in one project but only view, or not see, those of another.
If a button is disabled, a page says you don't have access, or a list comes back empty, missing permissions are the most likely cause — or, for whole product areas, the installed licence. You can review your own access under Profile → My access; an administrator can change your roles under IAM → Users.