Test run details
LicenseInt4 Shield Lite (2 of 3) · Custom add-on (1)Details
| Feature or limit | Int4 Shield Lite |
|---|---|
| Test reporting | Included |
| Test execution | Included |
| AI assistant chat | Add-on |
Anything a license model does not include can be added through a custom license. The license installed for you is shown in the app under Profile → License. All features by license
Overview
The test run page shows everything one test run did and found. You reach it by selecting a run in All Test Runs, on the Dashboard, in a scheduled run's history, from the notification you receive when your run finishes, or from a test case's execution history. While the run is still executing, the page updates live.
From top to bottom the page answers the questions a reviewer asks in turn:
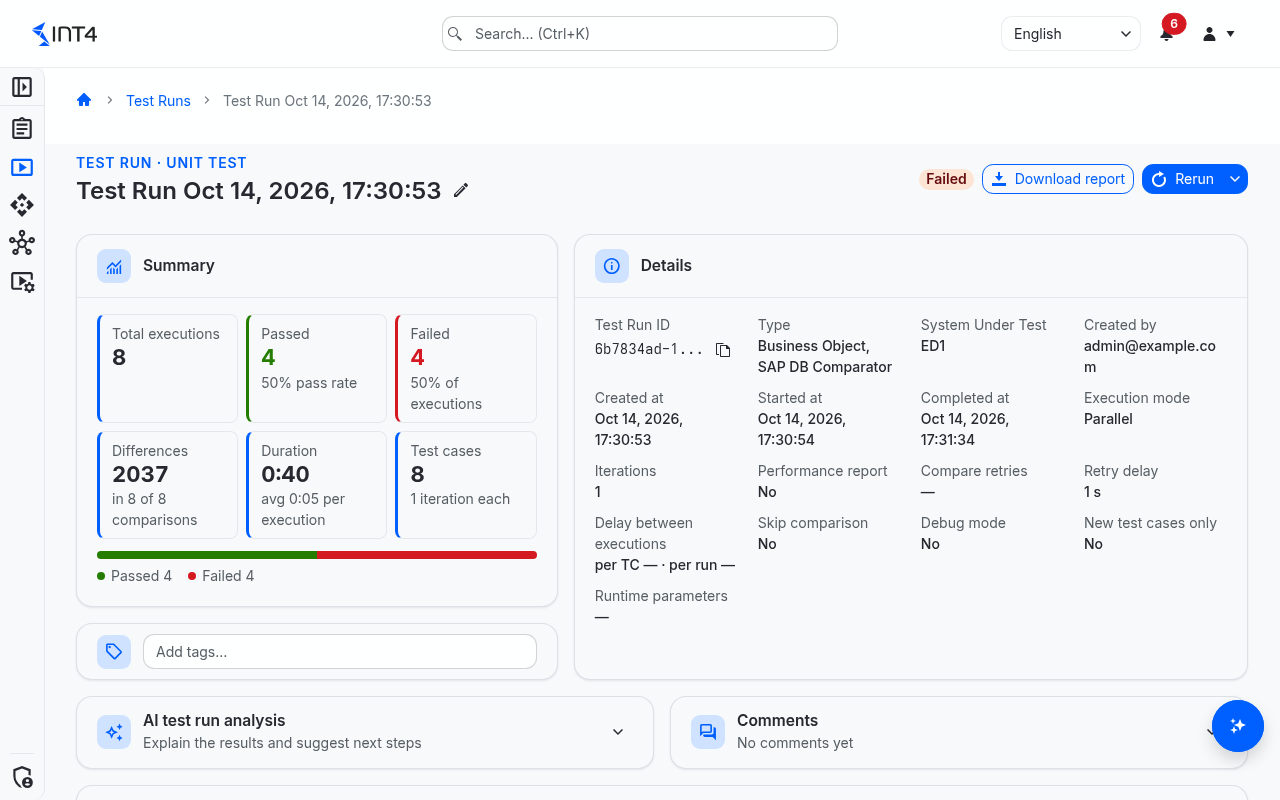
- How did it go? The header names the run type, the run and its status. Summary counts the test cases that passed and failed, the differences found and how long the run took, with a bar of the outcome. Details lists who started the run, when, against which systems and with which settings. Tags let you label the run for later filtering.
- Why did it fail? The AI analysis can summarise what went wrong (when your licence includes the AI assistant), and comments let everyone reviewing the run share what they found. Error summary collapses all errors of the run into distinct errors, most frequent first, so one broken mapping that hit two hundred test cases is one row.
- Where did it happen? When the run covered processes, each process is drawn as a map of its steps, marked with what each step came to. Performance appears when the run measured processing times. Test cases lists every test case of the run, grouped by folder.
Selecting a test case opens its own results page: the same summary for that one test case, its log, the data it used, and each comparison of expected against actual output, side by side.
What a test run is
A test run is one session that executes a selection of test cases against the systems under test. You can start a run by hand — for chosen test cases, whole folders, the test cases of an automation object, a saved search or a process —, replay an earlier run, or have it fire on a schedule. Either way the result is a single run that groups together the execution of every test case it covers.
A run only succeeds when all of its test cases pass. A single failure fails the run as a whole, but it does not stop the others: the remaining test cases still run, so one run gives you a complete picture rather than stopping at the first problem.
How a test run works
Underneath, every test case is exercised the same way — by replaying a known message and comparing the result. When a test case is created, Int4 Suite captures a reference: the input that was sent and the output the platform produced (the "before"). When the test case runs, the platform produces a fresh current result (the "after"), and the run compares the two. Because the comparison is always current-against-reference, the same test case can serve regression testing (same system over time), migration testing (reference from the old system, current from the new one), and test-driven development — only the source of "before" and "after" changes.
Each test case execution moves through four ordered phases:
- Prepare — resolve runtime variables and build the input payload (for example, stamping in a fresh document number).
- Execute — submit the message to the target system.
- Retrieve — read back what the platform actually produced. This phase polls, because the platform often processes asynchronously; if the result is not there yet, the run waits and tries again, up to the number of attempts set for the run or its automation object, before giving up.
- Compare — match the actual result against the expected reference, then run any custom validation scripts the automation object defines.
The phases are ordered because each depends on the one before it. The retrieve phase in particular relies on the integration platform having kept the message it processed — which is why trace and message retention on the platform is a precondition for capturing and replaying messages at all.
Test runs send real messages into the systems they test. Point them at test systems, never at productive ones.
Test cases that depend on each other
Some test cases build on another one: a child test case on its parent, or a step of a process on the step before it — for example, a delivery that can only be posted once the order exists. In a run, such a test case always starts after the one it depends on, and it can only be run together with it. If the earlier test case cannot be executed, the test cases after it are skipped. If it executes but its output differs from the reference, the later test cases still run.
The kinds of test
What a run actually does in the "execute" and "retrieve" phases depends on the test type of the automation object behind each test case. They fall into a few families:
- Injection — Int4 sends, then checks the result. Int4 Suite injects the reference input into the platform, lets it process, and then captures what the platform produced and compares it to the expected output. This is the most common pattern. Examples: SAP CI Injection, SAP PO Injection, IDoc Injection.
- Capture — Int4 reads a message the platform already produced. Nothing is injected. The run locates a message that has already left the platform, correlated to an earlier one, and compares it to the expected payload. Because there is no input to send, these tests depend entirely on the platform having kept that message. Examples: SAP CI Capture, SAP PO Capture.
- Calls — Int4 sends and gets the answer straight back. The response comes back in the same call and is compared with the reference. Examples: SAP PO Synchronous, HTTP Call.
- Database comparison — Int4 snapshots table content and re-checks it. No message is involved. When the test case is created, Int4 Suite records the database rows a reusable ruleset selects in an SAP backend; when it runs, it reads the same rows again and compares them with the snapshot. Example: SAP DB Comparator.
- File comparison — Int4 compares two files. The File Comparator contacts no system at all; it is useful for validating exports, snapshots or fixtures.
What the result tells you
For the run as a whole you see an overall status — still running, finished with everything passing, finished with failures, or completed with some test cases skipped or not compared. Alongside it, a run reports how many of its test cases passed, failed, or ended otherwise, so you can gauge the outcome at a glance.
Open an individual test case to see each comparison in detail. A comparison either matches or not, and each difference it finds is classed by the automation object's rules: an error fails the test case, a warning is an accepted difference that still passes but is worth a look, and an ignored difference does not count. The differences can be viewed in several ways (the original payloads, pretty-printed, as a text diff, as a table, or as a business view of EDI messages, where the payload supports it). Any custom validation scripts configured on the automation object appear next to the regular comparisons with their own pass/fail result — and a failed validation fails the test case just as a payload mismatch would, even when every payload matched.
Tasks
How to read the outcome of a run
- Check the status in the header: Passed, Completed, Failed, or Running while it is still executing.
- Read the tiles in Summary. Passed shows the pass rate; Failed shows how many test cases ended neither passed nor failed (skipped, or finished without a comparison), when there are any; Differences counts every difference found and in how many comparisons.
- While the run executes, the bar under the tiles also shows how far it has got.
- Open Details to check the settings the run used, such as the Execution mode, Iterations or whether Skip comparison was on. Use the copy button next to Test Run ID to copy the run's identifier, for example for a support request.
How to find the test cases behind an error
- Expand Error summary. Its heading already says how many distinct errors there are and how often they occurred.
- Each row is one distinct error: where it occurred, what kind it is (an execution error with the phase it happened in, a comparison difference, or a failed custom validation), how often it occurred and in how many test cases. The same error at a different position — another line item, another line number — is one row, with the number of variants.
- Select a row. Test cases below now shows only the test cases with that error, and a chip names the selection.
- Select the chip (Show all test cases again) to see all test cases again.
- To share the list, click Export to Excel in the error summary. The file also lists the affected test cases of every error.
How to find a test case in the run
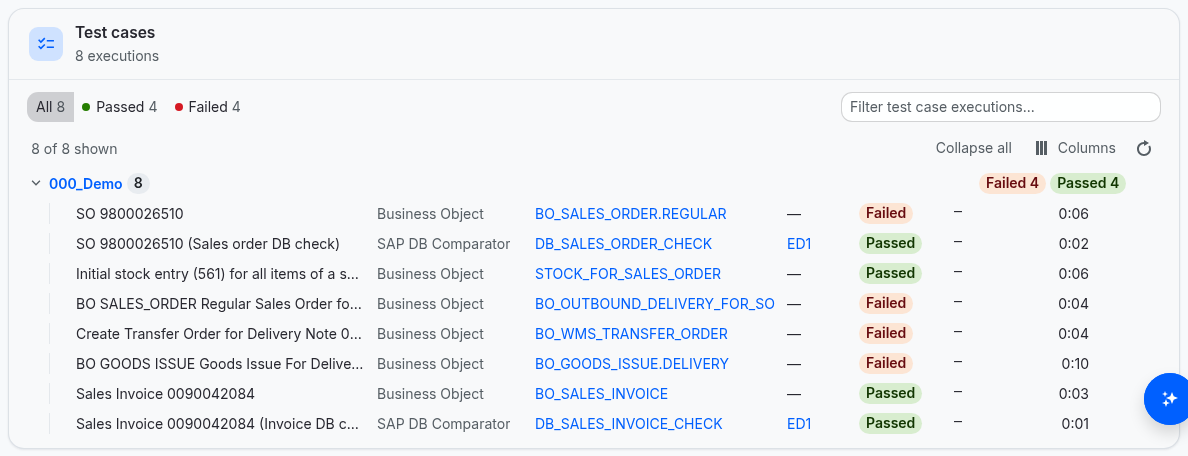
- In Test cases, use the status buttons to show all test cases, only the passed or only the failed ones; each button shows its count.
- Type in Filter test case executions... to filter by test case, folder, test type, automation object, system, correlation ID or status.
- Test cases are grouped by folder, and each folder row shows the count per status. Select the folder name to open that folder in the Cockpit.
- Select a test case row to open its results.
The marks in AI analysis and Comments show which test cases already have an AI analysis or comments.
How to follow a process through the run
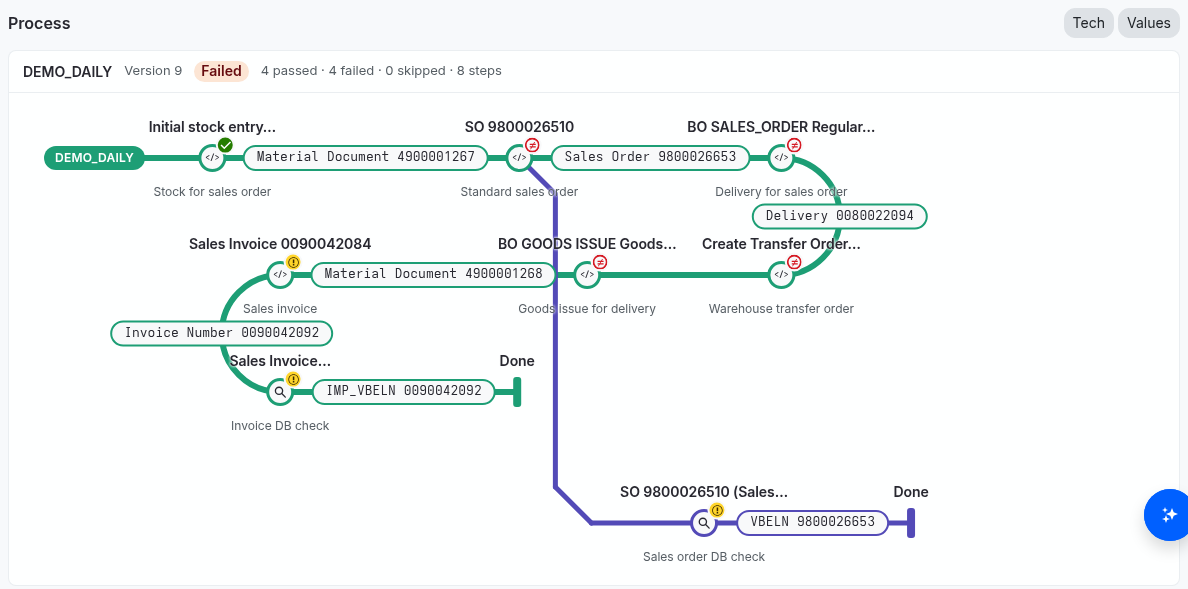
When the run covered one or more processes, a Processes section shows each process run as a map: one station per step, in the order the steps ran, branching where the process branches.
- Read each process's header: its version, its status, and how many steps passed, failed and were skipped. When the run executed only some of the process's steps, the header says it was a partial run and how many steps ran.
- Read the mark on each station; the legend below the maps (What the marks on the maps mean) names the marks that occur. A greyed station was not reached.
- The track after a step carries the document that step produced — for example the number of the order it created — so you can follow one business case through the chain.
- Switch on Values to show each step's business values, or Tech to show technical names instead of business names.
- Select a station to open that step's results.
A run that contains no process but has test cases depending on one another shows each chain of dependent test cases as a map too, marked Built from the run's parent chain.
How to inspect one test case
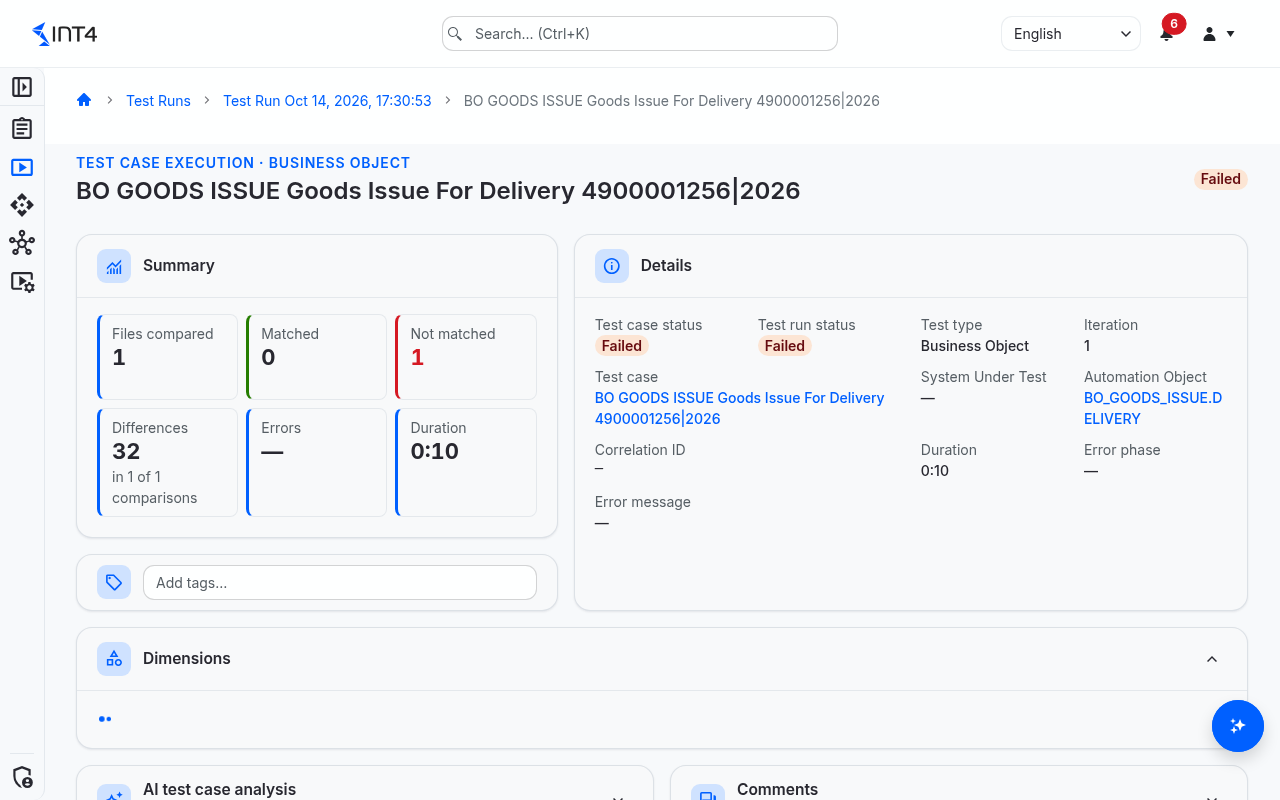
- Select the test case in the list, or its station on a process map. Its results page opens.
- Check Summary: how many files were compared and matched, the differences, the errors and the duration.
- In Details, the test case and the automation object link to the versions this run used, and the system under test to its page. If the test case could not be executed, Error phase and Error message say where and why.
- Expand Execution Information to read the log of this test case. Filter it by level; expand an entry for its details. Runs started with Debug Mode (Detailed Log) log more detail.
- Dimensions shows the business values of the test case version that ran. Execution data, when present, shows the runtime values the test case used and the payloads the run changed before sending them.
- Custom Validations shows the result of each custom validation of the automation object, with its result table.
How to compare expected and actual output
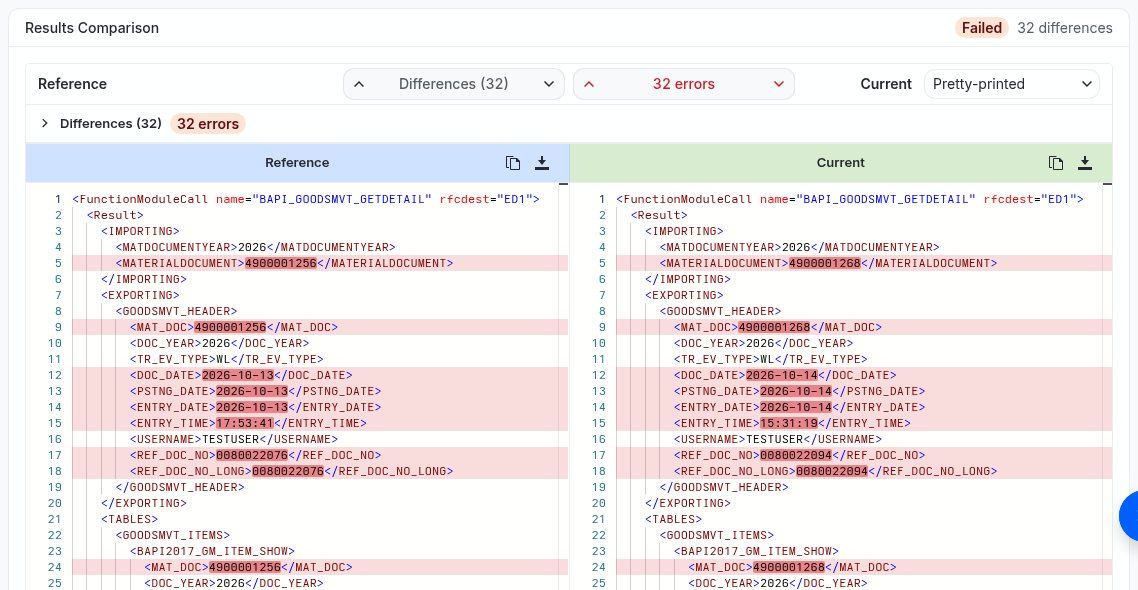
Each comparison in File results is a card with its result and number of differences. Inside, the reference output (Reference) is on the left and the output of this run (Current) on the right.
- Step through the differences with Previous difference and Next difference, or only through the errors with Previous error and Next error.
- Change the view in the selector at the top right. Only the views that suit the payload are offered:
- Pretty-printed — the compared structure, formatted, with the rows of both sides aligned. Comparisons open in this view unless they can be shown as a table.
- Original — the payloads exactly as received, including declarations, comments and original formatting.
- Text diff — a plain line-by-line text comparison of XML and JSON payloads, without the automation object's ignore rules.
- Table — one row per record and one column per field, with cells coloured by result. Comparisons that can be shown as a table, such as database comparisons, open in this view. Choose Show reference document, Show technical field names or Show differences only as needed.
- Semantic diff — for EDI messages such as EDIFACT: the payloads matched segment by segment, with interchanges and messages as separate nodes.
- Use the copy and download buttons on each side to take a payload with you.
The chosen view is kept in the page address, so a link you share opens the same view.
How to get an AI analysis
- On the run page, click Analyze run in AI test run analysis — or, on a test case's page, Analyze test case in AI test case analysis.
- The answer appears while it is written. Click Stop to stop it.
- A finished answer is kept and shown to everyone who opens the run, with who asked for it and when. Click Regenerate for a fresh one; it replaces the one shown.
How to comment on a run or a test case
- Expand Comments on the run page, or on a test case's page to comment on that test case only.
- Write your note and click Post comment, or press Ctrl+Enter.
Comments are listed oldest first with their author and time. They cannot be edited or deleted.
How to rename a run and tag it
- Click the run name in the header, or the pencil next to it. Type the new name and press Enter to save, or Esc to cancel.
- Type in the tags field below the summary (Add tags…) to add tags, or remove one. Every change is saved at once. Pick existing tags from the shared tag list or type a new one; you can later filter All Test Runs by them.
How to download a run report
- Open the run's detail page as described above. The button appears once the run has finished.
- Click Download report in the page toolbar. A file named
test-run-<first 8 characters of the run ID>.mhtmlis saved. - Open the file in Chrome or Edge. It is a static snapshot for sharing or archiving: the run summary and details, then every execution with its comparisons, the expected and actual payloads side by side, table views and custom validation results, and the execution log. Click an execution to open it; "Expand all" in the report opens all of them.
How to run it again
Once the run has finished, click Rerun in the header. A new run with the same selection and settings starts, and its page opens. To change settings first, open the menu next to the button and choose Rerun with Parameters. What a rerun includes is described in All Test Runs.
Field reference
Run summary and details
| Field | Description |
|---|---|
| Total executions | The number of test case executions in the run: every selected test case once per iteration. |
| Passed | Executions whose output matched the reference and whose custom validations passed, with the pass rate. |
| Failed | Executions whose output differed, whose custom validation failed, or that could not be executed. |
| Differences | All differences the comparisons found, whatever their class, and how many comparisons had any. |
| Duration | How long the run took, and the average per execution. |
| Test cases | The number of different test cases, and how many iterations each ran. |
| Type | The test types of the automation objects the run used. |
| System Under Test | The systems under test the run sent to. |
| Execution mode | Parallel: each test case goes through its phases on its own. Staggered: all test cases finish one phase before the next phase starts. |
| Compare retries / Retry delay | How often, and how many seconds apart, the run tried to read each result. Empty when the value was left to the automation objects. |
| Delay between executions | The waits between sending and reading results, per test case and once per run. Empty when left to the automation objects. |
| Performance report | Whether the run measured processing times; see Performance report. |
| New test cases only | Whether the run left out test cases that had run before. |
| Runtime parameters | Values given to the run for its test data. |
Test cases list
| Column | Description |
|---|---|
| Folder / Results | On a folder row: the folder's path, and how many of its test cases ended in each status. |
| Test case | The test case's description. |
| Test Type | The test type of its automation object. |
| Automation Object / System Under Test | What the test case used; each links to its page. |
| Iteration | Which repetition this is. Shown only when the run had more than one iteration. |
| Status | The test case's status, as described below. |
| Correlation ID | The identifier the target system gave the message, for finding it there. |
| Duration | How long the test case took. |
Test case statuses
| Status | Meaning |
|---|---|
| Pending | Not started yet — for example waiting for the test case it depends on. |
| Preparing, Executing, Retrieving Results, Comparing | The phase the test case is in. |
| Passed | The output matched the reference and every custom validation passed. |
| Failed | The output differed, a custom validation failed, or the test case could not be executed. |
| Completed | Finished without a verdict, for example because Skip Validation was on. |
| Skipped | Not run: you may not execute it, or a test case it depends on could not be executed. |
Marks on the process maps
| Mark | Meaning |
|---|---|
| Passed | The step's output matched. |
| Passed with warnings | The step passed, but accepted differences (warnings) were found — worth a look. |
| Output differs | The step ran, but its output differed. The steps after it still ran. |
| Not compared | The step ran without a comparison. |
| Stopped the run | The step could not be executed, so the steps after it were not run. |
| Not reached | The step was skipped; the station shows why. |
| Running / Waiting | The step is executing, or has not started yet. |
Test case results page
| Field | Description |
|---|---|
| Files compared | The comparisons of this test case, plus the number of custom validations. |
| Matched / Not matched | Comparisons that matched and that did not; failed custom validations count as not matched. |
| Errors | How often an error occurred in this test case, and how many distinct errors that was. |
| Test case status / Test run status | The status of this test case and of the whole run. |
| Iteration | Which repetition of the test case this is. |
| Correlation ID | The identifier the target system gave the message. |
| Error phase / Error message | For a test case that could not be executed: the phase it stopped in and the reason. |
Tips & edge cases
- Results belong to the versions that ran. A run keeps the test case and automation object versions it executed. Editing a test case afterwards does not change past results, and the links on the results page open the version that ran.
- A warning is not a failure. Differences that the automation object's rules class as warnings let the test case pass; a process map marks such steps Passed with warnings. Only errors fail it.
- Field names in database tables follow today's ruleset. The table view of a database comparison shows field names and row order from the ruleset as it is now, so editing the ruleset changes how older runs display. The compared values themselves do not change.
- The semantic view does not decide the result. For EDI messages the verdict still comes from the text comparison; the semantic view only makes the differences easier to read.
- A comparison that cannot be drawn says so. If a view cannot be prepared, the page falls back to the original payloads, and otherwise shows that the differences could not be rendered — never an empty, clean-looking comparison.
- The AI analysis needs a provider. If no AI provider is set up, the analysis explains that one must be configured in Global parameters. The analysis reads only the run's stored results; it changes nothing.
- The report is a snapshot with limits. It is written in the language and time zone of your Int4 Cloud session and needs no connection to be read; its only link opens the live run. So that it can be prepared within a minute, very large payloads and tables, payloads, tables and log entries past the report's size limit, and log entries beyond the first 200 of an execution are left out, and the report says so in their place. Very long log messages are shortened and end with "…". The live run always shows everything. If preparing the report still takes too long, you see The report took too long to generate. Try again later, or review the run in Int4 Cloud instead.. While other reports are being prepared, you are asked to try again in a moment.
- Renaming and tagging need write access. Everyone who can open the run sees the name and tags as editable, but saving a change needs Test Case: Write.
Related features
- All Test Runs
- Performance report
- Scheduled test runs
- Automation objects — where comparison rules and custom validations are set
- Test Cases cockpit
Prerequisites & permissions
To open a run you need the Test Case: Read permission in every project scope the run's test cases are filed in, and a licence that includes test reporting. The same access lets you post comments and read kept AI analyses.
- Asking for an AI analysis also needs a licence that includes the AI assistant.
- Renaming or tagging a run needs Test Case: Write in the run's scopes and a licence that includes test execution.
- Running it again needs Test Case: Execute, as described in All Test Runs.
About permissions. What you can see and do is decided by the roles assigned to your user. Each role bundles permission groups, and each permission group allows activities — Read, Write, Delete, Execute and, for schedules, Change owner — on a kind of record (for example Test Case, Automation Object, System Under Test). A role grants its groups per project scope, so you may be allowed to change records in one project but only view, or not see, those of another.
If a button is disabled, a page says you don't have access, or a list comes back empty, missing permissions are the most likely cause — or, for whole product areas, the installed licence. You can review your own access under Profile → My access; an administrator can change your roles under IAM → Users.